Fashion E-Commerce: Using Computer Vision to Find Clothing that Fits Like a Glove
Never let online trends get in the way of creating a great outfit for yourself.
![]()
Never let online trends get in the way of creating a great outfit for yourself.
![]()
In this tutorial, you'll learn to build an algorithm in Python that computes the measurements of a T-Shirt from an image. So roll up your sleeves, and follow along!
Here's some brief descriptions about the packages you'll rely on to build this program:
Did you know? Numpy along with libraries like SciPy and Matplotlib enabled the Event Horizon telescope to produce the first ever image of a black hole
import cv2
import imutils
import numpy as np
from imutils import contours
from imutils import perspective
from scipy.spatial import distance as dist
from matplotlib import pyplot as plt
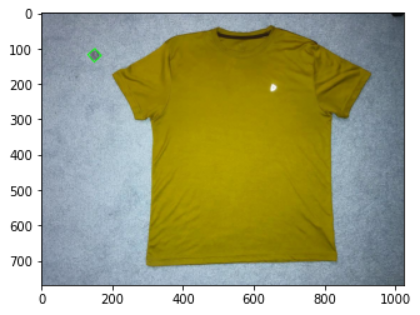
Good. Now that you have imported the libaries, let's begin by first importing an image of a T-Shirt. Assume that this T-Shirt is your current best-fit.
Use cv2.imread to read an image from your file system.
bestFitImage = cv2.imread('./images/outfits/best-fit-tshirt.jpeg')
For knowing what the image looks like, you can use Matplotlib's imshow function, which will read the image, and then use show to display it.
plt.imshow(bestFitImage)
plt.show()

You probably noticed that there is a circular object on the top left of this image. It's a US quarter, and it's there for a reason - to help determine the size of the outfit!
How? Let's understand the problem further.
Depending on how you take the photograph of the T-Shirt, it might appear smaller in the picture, or larger. So how would you know the true dimensions of the T-Shirt? Seems a bit complex right?
This ia a very common problem in applications that involve object and size detection. The most straight-forward and basic solution is to o define a ratio that measures the number of pixels per a given metric. For this, you'll use a reference object, an object that is uniquely identifiable in some manner. This object should have a couple of important properties:
A US Quarter serves as a good reference object, because you already know it's size, and it's a shape that's unique so therefore easy to identify. You'll place it on the top left before clicking the photograph. Then, here's what you'll do:
pixels_per_metric = object_width / known_width
A US quarter has a known_width of 0.955 inches. So if your object_width (measured in pixels) is computed be 150 pixels wide (based on its associated bounding box), the pixels_per_metric will be:
pixels_per_metric = 150px / 0.955in = 157px.
This means, that there are approximately 157 pixels per every 0.955 inches in our image. Using this ratio, we can compute the size of objects in an image.
Source: I found this excellent tutorial from PyImageSearch
Now that you've got the gist of it, let's begin coding!
gray = cv2.cvtColor(bestFitImage, cv2.COLOR_BGR2GRAY)
gray = cv2.GaussianBlur(gray, (7, 7), 0)

# Let's see how the gray-scaled image looks like
plt.imshow(gray)
plt.show()

Tip: At any point, if you need to know what a variable contains, or need to see what the results of a certain image processing technique, feel free to use Python's
imshowandshowmethods
edged = cv2.Canny(gray, 50, 100)
edged = cv2.dilate(edged, None, iterations=1)
edged = cv2.erode(edged, None, iterations=1)

# Display the result
plt.imshow(edged)
plt.show()

# find contours in the edge map
cnts = cv2.findContours(edged.copy(), cv2.RETR_EXTERNAL, cv2.CHAIN_APPROX_NONE)
cnts = imutils.grab_contours(cnts)

# Print the result
# print(cnts)
Now you have the contours, you'll sort them from left-to-right. Then you'll find the max of these contours, which is the area that your T-shirt occupies
# sort the contours from left-to-right and

(cnts, _) = contours.sort_contours(cnts)
cmax = max(cnts, key=cv2.contourArea)
# print(cmax) # Prints [[[646  35]], [[645  36]], [[644  37]] ... [[649  35]], [[648  35]], [[647  35]]]
An image moment is a certain particular weighted average (moment) of the image pixels' intensities. It allows you to find image properties such as its area (or total intensity), its centroid, and information about its orientation.
# Get the image moment and use it to find the centre
M = cv2.moments(cmax)
# print(M)

# Find the center
cX = int(M["m10"] / M["m00"])
cY = int(M["m01"] / M["m00"])
print(cX, cY)
564 373
height, width, color = bestFitImage.shape
blank_image = np.zeros((height, width, 3), np.uint8)
blank_image.fill(255) # or img[:] = 255
blank_image =cv2.cvtColor(blank_image, cv2.COLOR_RGB2BGR)
blank_image[:] = (216, 216, 216)
blank_image[:] = (216, 216, 216)

# Display the result
plt.imshow(blank_image)
plt.show()

pixels_per_metric variable and initialize it to None in the beginning.¶pixels_per_metric = None
known_width = 0.995 # Width of a US quarter (in inches)
You'll loop over the contours in-order to examine them. On each loop:
Since the reference object is on the top-left, the first iteration will create an outline on the US quarter, and the 2nd iteration would create an outline on the T-Shirt, like this:

Next, check if the pixels_per_metric variable is initialized. If it isn't, then you'll use the bounding box to calculate the euclidian distance in pixels. This will be the value of object_width in the pixels_per_metric formula
Next, you'll find the top and bottom points of the T-shirt, as well as the Top and Bottom points of the T-shirt sleeve. You'll need these in-order to calculate the width and the height of the T-shirt and also the width of the T-shirt sleeve:
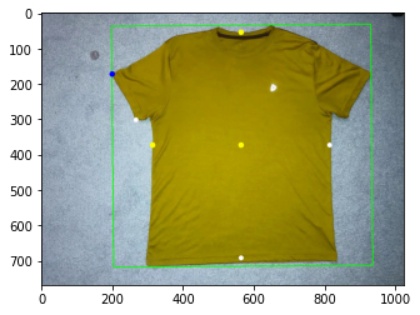
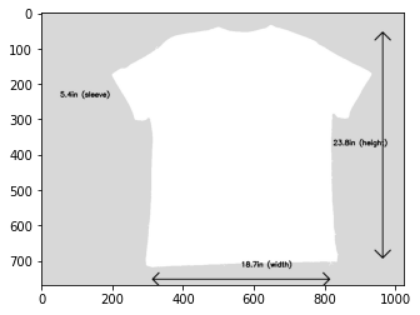
Finally, you'll label the measurements on the T-shirt!
# First define a helper function that calculates the mid-point between 2 pairs of coordinates

def midpoint(ptA, ptB):
    return ((ptA[0] + ptB[0]) * 0.5, (ptA[1] + ptB[1]) * 0.5)
# loop over the contours to examine them
for c in cnts:
    if cv2.contourArea(c) < 100:
        continue
    orig = bestFitImage.copy()

    box = cv2.minAreaRect(c)
    box = cv2.cv.BoxPoints(box) if imutils.is_cv2() else cv2.boxPoints(box)
    box = np.array(box, dtype="int")

    # order the points in the contour such that they appear in top-left, top-right, bottom-right, and bottom-left order,
    # then draw the outline of the rotated bounding box
    box = perspective.order_points(box)
    cv2.drawContours(orig, [box.astype("int")], -1, (0, 255, 0), 2)

    # Calculate the pixels_per_metric variable
    if pixels_per_metric is None:
        (tl, tr, br, bl) = box
        (tlblX, tlblY) = midpoint(tl, bl)
        (trbrX, trbrY) = midpoint(tr, br)
        dB = dist.euclidean((tlblX, tlblY), (trbrX, trbrY))
        pixels_per_metric = dB / known_width

    # If the contour is that of the T-shirt, then calculate the following:
    if cv2.contourArea(c) == cv2.contourArea(cmax):
        cv2.drawContours(blank_image, [cmax], -1, (255, 255, 255), -1)
        # calculate the top for the left sleeve
        leftSleeve_top = tuple(c[c[:, :, 0].argmin()][0])

        # intialize ext bottom ext top and centres
        extBotleft = (0, 0)
        extTop = (0, 0)
        centre = (cX, cY)

        # Calculate the extreme top point of the contour
        for yp in range(cY, 0, -1):
            isOnContour = cv2.pointPolygonTest(c, (cX, yp), False)
            if isOnContour == 0:
                extTop = (cX, yp)
                break

        # calculate the bottom left point of the contour
        for xp in range(cX, 0, -1):
            isOnContour = cv2.pointPolygonTest(c, (xp, cY), False)
            if isOnContour == 0:
                extBotleft = (xp, cY)
                break

        widx = dist.euclidean(centre, extBotleft)
        widy = dist.euclidean(centre, extTop)

        extBotRight = (int(cX + widx), cY)
        extDown = (cX, int(cY + widy))

        # calculate the bottom point of the left sleeve
        leftSleeve_bottom = (0, 0)
        yold = leftSleeve_top[1]
        found = False
        for x in cmax:
            for y in x:
                if leftSleeve_bottom != (0, 0):
                    break
                if tuple(y) == leftSleeve_top:
                    found = True
                if found and yold >= y[1]:
                    leftSleeve_bottom = tuple(y)
                else:
                    yold = y[1]

        # Draw points
        cv2.circle(orig, leftSleeve_top, 8, (0, 0, 255), -1)
        cv2.circle(orig, leftSleeve_bottom, 7, (255, 255, 255), -1)
        cv2.circle(orig, extBotleft, 8, (255, 255, 0), -1)
        cv2.circle(orig, extBotRight, 7, (255, 255, 255), -1)
        cv2.circle(orig, extTop, 8, (255, 255, 0), -1)
        cv2.circle(orig, extDown, 7, (255, 255, 255), -1)
        cv2.circle(orig, centre, 8, (255, 255, 0), -1)

        # Calculate the dimensions of the T-shirt! (width, height, and the dimensions of the sleeve)
        outfit_width = widx / pixels_per_metric * 2
        outfit_height = widy / pixels_per_metric * 2

        sleevedist = dist.euclidean(leftSleeve_top, leftSleeve_bottom)
        outfit_sleeve = sleevedist / pixels_per_metric

        # print the measurements
        print(F"T-shirt width: {outfit_width} inches")
        print(F"T-shirt height: {outfit_height} inches")
        print(F"T-shirt sleeve: {outfit_sleeve} inches")

        # Draw and label the measurements on the T-shirt image
        displaypoint = midpoint(leftSleeve_top, leftSleeve_bottom)

        cv2.arrowedLine(blank_image, (int(centre[0] - widx), int(centre[1]+widy+60)), (int(centre[0] + widx), int(centre[1]+widy+60)),
                     (0, 0, 0), 2, tipLength=0.05)
        cv2.arrowedLine(blank_image,
                        (int(centre[0] + widx), int(centre[1] + widy + 60)),
                        (int(centre[0] - widx), int(centre[1] + widy + 60)),
                        (0, 0, 0), 2, tipLength=0.05)
        cv2.arrowedLine(blank_image, (int(centre[0] + widx+150), int(centre[1] - widy)), (int(centre[0]+widx+150), int(centre[1] + widy)),
                 (0, 0, 0), 2, tipLength=0.05)
        cv2.arrowedLine(blank_image,  (int(centre[0] + widx + 150), int(centre[1] + widy)),
                        (int(centre[0] + widx + 150), int(centre[1] - widy)),
                        (0, 0, 0), 2, tipLength=0.05)

        cv2.putText(blank_image, "{:.1f}in (sleeve)".format(outfit_sleeve),
                    (int(displaypoint[0]-180), int(displaypoint[1])), cv2.FONT_HERSHEY_SIMPLEX,
                    0.65, (0, 0, 0), 2)
        cv2.putText(blank_image, "{:.1f}in (width)".format(outfit_width),
                    (int(extDown[0]), int(extDown[1] + 25)), cv2.FONT_HERSHEY_SIMPLEX,
                    0.65, (0, 0, 0), 2)

        cv2.putText(blank_image, "{:.1f}in (height)".format(outfit_height),
                    (int(extBotRight[0] + 10), int(extBotRight[1])), cv2.FONT_HERSHEY_SIMPLEX,
                    0.65, (0, 0, 0), 2)

        plt.imshow(blank_image)
        plt.show()

    # Display the result
    plt.imshow(orig)
    plt.show()

T-shirt width: 18.720345280833584 inches
T-shirt height: 23.81227919722032 inches
T-shirt sleeve: 5.442439360681042 inches


Once you have the measurements for both, you can compare their differences and calculate the percentage of best fit!
The right choice is hardly ever the easy choice. But it can be a smart one!